

Alright, boss?
Grafana is an open source metric analytics & visualization suite. It is most commonly used for visualizing time series data for infrastructure and application analytics but many use it in other domains including industrial sensors, home automation, weather, and process control.
https://grafana.com/
http://docs.grafana.org/guides/getting_started/
InfluxDB is an open-source time series database developed by InfluxData.
it is written in Go and optimized for fast, high-availability storage and retrieval of time series data in fields such as operations monitoring, application metrics, Internet of Things sensor data, and real-time analytics.
Install InfluxDB on Raspberry Pi
https://gist.github.com/boseji/bb71910d43283a1b84ab200bcce43c26
You can follow the link for more details but basically, I just run this:
1 2 3 4 5 6 7 | sudo apt-get update && sudo apt install apt-transport-https curl curl -sL https://repos.influxdata.com/influxdb.key | sudo apt-key add - echo "deb https://repos.influxdata.com/debian jessie stable" | sudo tee /etc/apt/sources.list.d/influxdb.list sudo apt-get update && sudo apt-get install influxdb |
For this example we don’t care about the web-based Admin user interface.
To start the server
1 | sudo service influxdb start |
Install Grafana on Raspberry Pi
https://github.com/fg2it/grafana-on-raspberry/wiki
You can follow the link for more details but basically, I just run this:
1 2 3 4 5 6 7 8 9 | sudo apt-get install apt-transport-https curl curl https://bintray.com/user/downloadSubjectPublicKey?username=bintray | sudo apt-key add - echo "deb https://dl.bintray.com/fg2it/deb jessie main" | sudo tee -a /etc/apt/sources.list.d/grafana.list sudo apt-get update sudo apt-get install grafana |
To start the server
1 | sudo service grafana-server start |
With everything installed you are ready to start doing some awesome things.
I going to show two examples here:
One using sense-hat to get the temperature, pressure and humidity value
and other using HS110 to get the energy consumption
Here is a good InfluxDB getting started
https://docs.influxdata.com/influxdb/v0.8/introduction/getting_started/
1 | influx -precision rfc3339 |
1 | CREATE DATABASE logger |
You can test with
1 | SHOW DATABASES |
To run the code you need Install the python package first
1 | sudo pip install influxdb |
Both examples are quite similar. Just change what I write on the table.
This code is a hack from some Google examples.
1 2 3 4 5 6 7 8 9 10 11 12 13 14 15 16 17 18 19 20 21 22 23 24 25 26 27 28 29 30 31 32 33 34 35 36 37 38 39 40 41 42 43 44 45 46 47 48 49 50 51 52 53 54 55 56 57 58 59 60 61 62 63 64 65 66 67 68 69 70 71 72 73 74 75 76 77 78 79 80 81 82 83 84 85 86 87 88 89 | import argparse import time import datetime import sys from influxdb import InfluxDBClient from sense_hat import SenseHat sense=SenseHat() # Set required InfluxDB parameters. host = "localhost" #Could also set local ip address port = 8086 user = "root" password = "root" # How frequently we will write sensor data from SenseHat to the database. sampling_period = 5 def get_args(): '''This function parses and returns arguments passed in''' # Assign description to the help doc parser = argparse.ArgumentParser(description='Program writes measurements data from SenseHat to specified influx db.') # Add arguments parser.add_argument( '-db','--database', type=str, help='Database name', required=True) parser.add_argument( '-sn','--session', type=str, help='Session', required=True) now = datetime.datetime.now() parser.add_argument( '-rn','--run', type=str, help='Run number', required=False,default=now.strftime("%Y%m%d%H%M")) # Array of all arguments passed to script args=parser.parse_args() # Assign args to variables dbname=args.database runNo=args.run session=args.session return dbname, session,runNo def get_data_points(): # Get the three measurement values from the SenseHat sensors temperature = sense.get_temperature() pressure = sense.get_pressure() humidity = sense.get_humidity() # Get a local timestamp timestamp=datetime.datetime.utcnow().isoformat() print ("{0} {1} Temperature: {2}{3}C Pressure: {4}mb Humidity: {5}%" .format(session,runNo, round(temperature,1),u'u00b0'.encode('utf8'), round(pressure,3),round(humidity,1))) # Create Influxdb datapoints (using lineprotocol as of Influxdb >1.1) datapoints = [ { "measurement": session, "tags": {"runNum": runNo, }, "time": timestamp, "fields": { "temperaturevalue":temperature,"pressurevalue":pressure,"humidityvalue":humidity } } ] return datapoints # Match return values from get_arguments() # and assign to their respective variables dbname, session, runNo =get_args() print "Session: ", session print "Run No: ", runNo print "DB name: ", dbname # Initialize the Influxdb client client = InfluxDBClient(host, port, user, password, dbname) try: while True: # Write datapoints to InfluxDB datapoints=get_data_points() bResult=client.write_points(datapoints) print("Write points {0} Bresult:{1}".format(datapoints,bResult)) sense.show_message("OK") # Wait for next sample time.sleep(sampling_period) # Run until keyboard ctrl-c except KeyboardInterrupt: print ("Program stopped by keyboard interrupt [CTRL_C] by user. ") |
The HS110 example I just change some lines:
1 2 3 4 5 6 7 8 9 10 11 12 13 14 | consumption = plug.get_emeter_realtime()[“power”] # Create Influxdb datapoints (using lineprotocol as of Influxdb >1.1) datapoints = [ { "measurement": session, "tags": {"runNum": runNo, }, "time": timestamp, "fields": { "consumption":consumption } } ] return datapoints |
To run:
1 | python igor.py -db=logger -sn=test1 |
To setup Grafana:
http://localhost:3000
Go to Datasource->Add New and fill in with your database details
User and psw should be: “root” and “root” by default

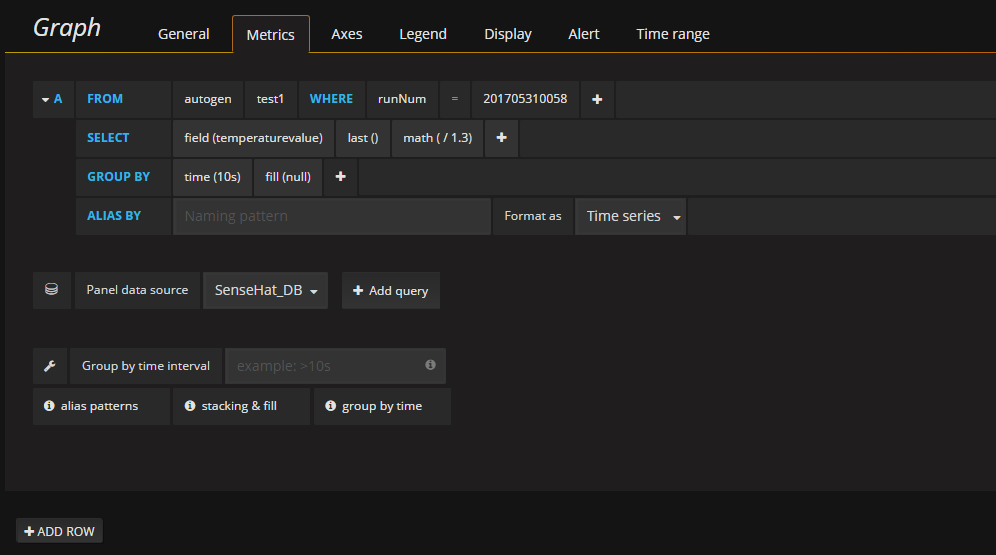
Create a new dashboard, choose your database and on the tab matrics configure your query.
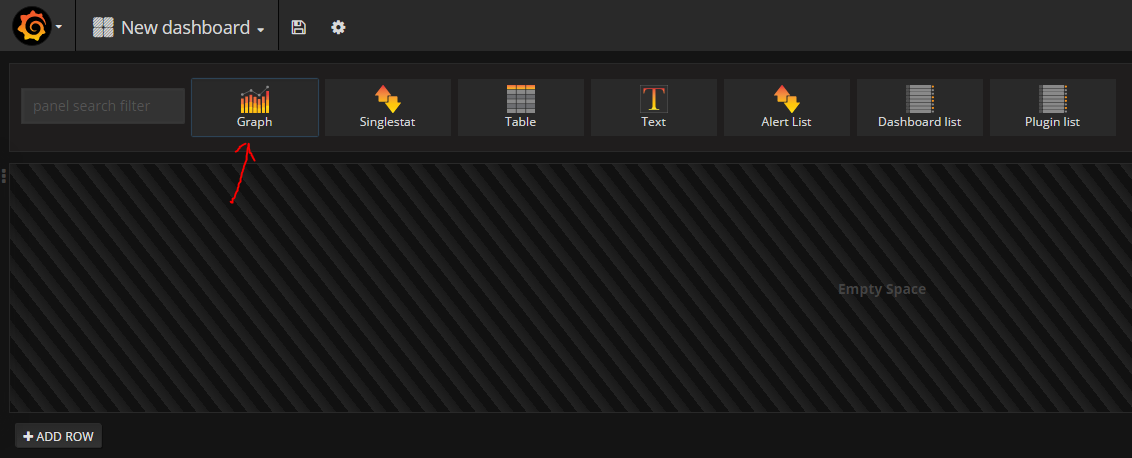
Edit the dashboard and go to metrics.

Choose the database and then configure the query.
Sense hat + Grafana = on fly himidity, temperature and pressure dashboard pic.twitter.com/bp0d8jTXXZ
— Igor Souza (@Igfasouza) February 26, 2018
If you succeed in create your dashboard let a comment below about what are you doing.